
The Strategic Significance of the 200-Day Moving Average in Gold Market Timing
For seasoned investors and market analysts, the 200-day moving average (MA) stands as a critical technical indicator, distilling long-term trend insights that facilitate strategic decision-making in gold trading. Its application extends beyond mere chart analysis; it embodies a synthesis of market psychology and historical price action, guiding discerning investors toward optimal entry points amidst volatile conditions.
Decoding Market Sentiment: Why the 200-Day MA Serves as a Reliable Market Barometer
The 200-day MA functions as a dynamic support or resistance level, reflecting the prevailing investor sentiment and institutional positioning. Gold, often viewed as a hedge against inflation and geopolitical uncertainties, exhibits pronounced reactions to movements around this average. When prices cross above the 200-day MA, it signals potential bullish momentum, whereas a drop below may indicate bearish tides—crucial cues for timing entry and exit strategies.
Complexities of Trend Identification and Signal Confirmation
While the 200-day MA provides a long-term perspective, its efficacy hinges upon complementary analysis—such as volume confirmation and other momentum indicators. False signals can emerge during sideways consolidation or sudden market shocks; hence, a nuanced understanding of its limitations and integration with oscillators like RSI or MACD enhances predictive accuracy. This layered approach is vital for professional-grade gold investment strategies, particularly in volatile markets influenced by macroeconomic headline risks.
Distinct Advantages Over Shorter Moving Averages in Gold Trading
Compared to 50-day or 20-day MAs, the 200-day MA filters out short-term noise, allowing traders to focus on fundamental shifts rather than transient fluctuations. This attribute is especially beneficial in the gold market, where macro trends—such as central bank policies or dollar strength—drive sustained price movements. By anchoring entry points around the 200-day MA, traders can align their tactics with broader market cycles, reducing emotional trading and enhancing portfolio resilience.
Integrating the 200-Day Moving Average into Sophisticated Portfolio Construction
Incorporating the 200-day MA within a comprehensive technical framework enables more refined risk management. For instance, a trader might consider scaling into positions when gold prices confirm a bullish trend above the 200-day MA, supplemented by volume spikes indicating institutional accumulation. Conversely, descending below this threshold could trigger unwinding or hedging, aligning with the modern portfolio theory of optimal risk-adjusted returns. Such practices are essential for contrarian investors aiming to leverage long-term trend signals in gold portfolios.
What are the pitfalls of relying solely on the 200-day MA for gold timing, and how can professional traders mitigate these risks?
Relying exclusively on the 200-day MA may result in lagging signals during sudden market reversals or false breakouts. To mitigate this, expert traders combine it with other analytical tools such as candlestick pattern analysis, fundamental macroeconomic reports, and sentiment indicators. Employing a multi-layered approach ensures that entry points are not only technically sound but also corroborated by market context, reducing exposure to whipsaws and maintaining a strategic advantage.
For a deeper understanding of silver and gold correlations, consult [Gold’s Role in Portfolio Diversification](https://www.researchgate.net/publication/343769498_Gold_as_a_Hedge_Alternative_in_Portfolio_Diversification).
If you are keen to refine your gold trading strategies further, explore our comprehensive guide on [Advanced Gold Investment Techniques](https://buyingoldnow.com/how-to-spot-a-fake-gold-bar-before-the-transaction-2). Engage with fellow experts by sharing your insights on optimizing entry timing within professional trading forums and contribute to the evolving knowledge base of gold market strategies.
Beyond the 200-Day: Fine-Tuning Your Gold Entry Points for Precision
While the 200-day moving average remains a cornerstone for long-term trend analysis, savvy investors recognize the importance of integrating additional layers of technical signals. Shorter-term moving averages, such as the 50-day or 20-day, can offer timely confirmation, narrowing the window for optimal entry and exit points. For instance, a bullish crossover—where the 50-day MA crosses above the 200-day MA—often signals a robust trend reversal, providing a clearer signal to act. Conversely, divergences between these averages might flag impending reversals or consolidations, prompting traders to exercise caution.
Embracing the Power of Volume and Momentum Indicators
Technical indicators such as volume spikes or momentum oscillators like the Relative Strength Index (RSI) and Moving Average Convergence Divergence (MACD) are essential companions to moving averages. When a gold price rises above the 200-day MA accompanied by increasing volume, it strengthens the validity of the trend, reducing false signals. Similarly, an RSI approaching overbought levels might caution against aggressive long positions, even if the trend appears bullish. Integrating these tools creates a multi-dimensional framework, enabling traders to confirm signals and reduce reliance on lagging indicators alone.
How can advanced pattern recognition and macroeconomic analysis refine your gold timing strategies?
Expert traders leverage pattern recognition—such as head and shoulders, double bottoms, or cup and handle formations—in conjunction with macroeconomic themes like inflation expectations, dollar strength, and geopolitical tensions. Recognizing these patterns enhances the predictive power of moving averages, allowing for better anticipation of trend shifts. Additionally, tracking central bank policies and international monetary flows, as discussed in this comprehensive guide on central bank interventions, provides context for pressuring or supporting gold prices, refining timing accuracy.
If you want to deepen your understanding of combining technical analysis with macroeconomic insights, consider exploring our detailed resource on How to Buy Gold Bullion Without Excess Markups. Sharing your own experiences and strategies in professional trading forums can foster collective growth and refined decision-making in these complex markets.
Honing Your Precision: Combining Moving Average Signals with Market Sentiment Shifts
As seasoned investors know, technical signals alone rarely tell the full story. Integrating the 200-day moving average with real-time crowd sentiment, news flow, and macroeconomic data enriches your decision matrix. For instance, a breakout above the 200-day MA accompanied by surging open interest in futures contracts may signal institutional accumulation, reinforcing a bullish stance. Conversely, a sudden spike in geopolitical tensions or inflation reports can catalyze momentum, making timing more strategic. Such holistic analysis ensures that technical entries are contextualized within prevailing market narratives, minimizing false signals and enhancing convergence of indicators.
How Divergences Signal Hidden Market Risks in Gold Trades
Beyond straightforward crossovers, divergences between price action and momentum indicators often reveal underlying vulnerabilities in prevailing trends. A classic example involves a scenario where gold prices hover above the 200-day MA, yet the RSI begins diverging downward, signaling waning bullish momentum. This discrepancy may presage a consolidation or pullback—acting as an early warning system for traders. Recognizing these subtle cues demands rigorous chart analysis and a keen understanding of market psychology, equipping professionals to preempt sharp reversals and refine their risk management strategies.
Empowering Portfolio Resilience with Dynamic Entry and Exit Strategies
In volatile markets characterized by sudden swings, static trade models risk substantial drawdowns. Instead, dynamic strategies—such as tiered position entry based on confirmed trend strength—offer resilience. For example, initiating a partial position once the gold price conclusively breaks above the 200-day MA, then adding on subsequent confirmations like volume surges or a bullish MACD crossover, creates a layered defense. Similarly, layering stop-losses just below recent swing lows or the 200-day MA guard against abrupt reversals. Adopting such adaptive tactics underscores the importance of flexibility and continuous market analysis for professional-grade gold investing.
Addressing the Pitfalls: How to Avoid Common Errors with Moving Averages
Relying solely on the 200-day MA can lead traders astray during choppy markets or during false breakouts. For example, a rapid spike above the MA may tempt premature entries, only for prices to revert swiftly. To prevent such costly missteps, sophisticated traders employ confirmation software that filters out minor breaches, such as waiting for sustained closes above or below the MA over multiple sessions or incorporating volatility-adjusted indicators like Bollinger Bands. Moreover, applying candlestick reversal patterns—such as engulfing or shooting stars—can provide additional validation, thereby improving decision quality and reducing emotional reactions.
In the intricate dance of gold trading, understanding the composite signals and their limitations is paramount. Exploring layered analytical frameworks that blend top-down macroeconomic insights with granular technical cues elevates your strategic edge, empowering you to anticipate and act decisively in unpredictable markets. Stay tuned for our next comprehensive segment, where we delve into the nuances of macroeconomic indicator integration with technical analysis—an essential frontier for sophisticated investors.
Refining Timing Accuracy: The Synergy of Moving Averages and Market Liquidity Dynamics
In sophisticated gold trading strategies, understanding how liquidity fluctuations interact with the 200-day MA signal can significantly enhance entry and exit precision. Large institutional players often influence liquidity, causing abrupt price movements that may either reinforce or distort the trend signals indicated by the moving average. By analyzing bid-ask spreads and order book depth alongside the 200-day MA trends, astute traders can discern genuine trend shifts from transient liquidity-driven anomalies, thereby calibrating their tactics for optimal timing with higher confidence.
Uncovering the Subtleties of Seasonal and Cyclical Influences on Gold Behavior
Beyond technical indicators, seasonal patterns and cyclical behaviors can profoundly impact gold’s relationship with the 200-day moving average. Historical data indicates recurrent seasonal upticks during particular months—such as Q2 and Q4—linked to macroeconomic events and fiscal calendars. Recognizing these patterns and integrating them with the trajectory indicated by the 200-day MA enables traders to distinguish persistent trends from predictable seasonal noise, thereby sharpening the fidelity of their timing models and reducing false signals during these recurrent phases.
Can Machine Learning Enhance the Reliability of 200-Day Moving Average Signals?
Emerging advanced analytics, including machine learning algorithms, hold promise for elevating the predictive capacity of traditional indicators like the 200-day MA. By training models on multi-factor datasets—including macroeconomic variables, sentiment indices, and high-frequency price data—traders can develop adaptive systems capable of recognizing complex patterns and subtler divergences that elude conventional methods. Integrating these models into technical analysis frameworks allows for dynamic adjustments of trade signals, reducing lag and increasing robustness in volatile markets, especially when macro and geopolitical shocks occur unexpectedly.
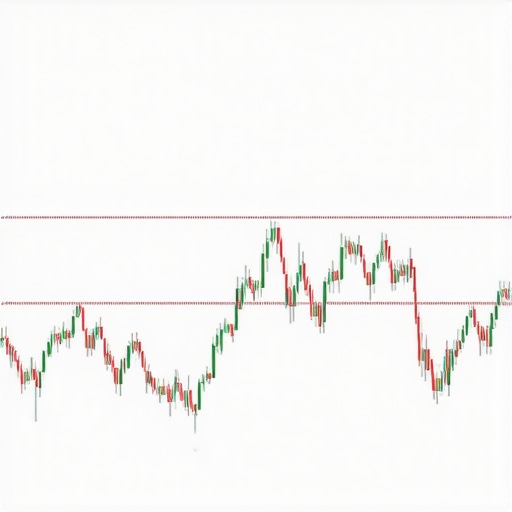
Depict a graph illustrating machine learning model detection of trend divergences around the 200-day moving average, highlighting predictive signals and macroeconomic overlays.
Engage with Cutting-Edge Approaches to Secure Your Gold Positions
As the landscape of gold trading evolves, embracing multidisciplinary tactics—merging statistical learning, macroeconomic analytics, and deeply refined technical signals—becomes imperative. For investors committed to maintaining a competitive edge, collaborating with quantitative analysts or utilizing advanced analytical platforms can exponentially enhance decision-making precision. Explore emerging tools and techniques to unlock new levels of confidence in your long-term trend assessments, and share your insights in forums dedicated to systematic trading approaches for precious metals.
How Can Integrating Sentiment Analysis Transform Your Gold Entry Strategies?
Incorporating sentiment metrics derived from news analytics, social media trends, and macroeconomic forecast revisions provides an additional layer of context to the readings of the 200-day MA. Sudden shifts in market sentiment can precede technical signals of trend reversals, allowing traders to position themselves proactively. For example, a spike in geopolitical concerns reflected in news sentiment often correlates with increased gold demand, which, if detected early, can synchronize well with moving average signals for more timely entries or exits. Harnessing sentiment analysis tools to complement the technical framework empowers traders to anticipate and react more effectively to evolving market narratives.
Expert Insights and Advanced Considerations
Leverage Multi-Indicator Confirmation for Robust Signals
Combining the 200-day moving average with other technical tools like volume analysis and momentum oscillators enhances trend validity and reduces false alarms, enabling more precise entry and exit points.
Stay Ahead with Macro and Sentiment Analysis
Integrate macroeconomic indicators and market sentiment metrics to contextualize technical signals, anticipating trend shifts driven by fiscal policy, geopolitical events, or investor mood swings.
Harness Pattern Recognition to Anticipate Reversals
Identifying chart formations such as double bottoms or head and shoulders in conjunction with moving average signals provides early warning of potential trend reversals, improving strategic planning.
Incorporate Machine Learning for Dynamic Signal Adjustment
Utilize predictive models trained on multi-faceted datasets to adapt traditional indicators like the 200-day MA, increasing responsiveness and reducing lag in volatile markets.
Balance Long-Term Trends with Seasonal and Cyclical Tendencies
Align technical signals with historical seasonal patterns and market cycles to distinguish enduring trends from short-term noise, refining timing accuracy for entry and exit points.
Curated Expert Resources
- Gold’s Role in Portfolio Diversification: Offers comprehensive analysis of gold as a hedging instrument, enhancing understanding of its strategic value in diversified portfolios.
- How to Spot a Fake Gold Bar: A critical resource for verifying authenticity, safeguarding investments against counterfeit risks.
- Stop Trading Gold Futures: Details on recognizing and avoiding common pitfalls in futures trading, emphasizing the importance of physical bullion.
- Central Bank Gold Strategies: Insights into institutional shifts that influence market direction and timing.
- Buying Gold Bullion Direct: Practical guidance on acquiring physical gold efficiently, reducing premiums and markup costs.
Final Perspective: Elevating Gold Trading Beyond the Basics
Integrating expert-level analysis, macroeconomic awareness, and advanced technology into your gold market approach transforms routine strategies into a dynamic edge. The 200-day moving average, while foundational, gains potency when enriched by layered insights—making your timing decisions more accurate and resilient amid market chaos. Staying committed to continuous learning and strategic refinement is essential for seasoned investors seeking to master gold market timing. Engage actively with our community of professionals and explore sophisticated resources to deepen your expertise, ensuring your portfolio remains fortified against uncertainty and poised for growth.
About the Author
Martin Tremblay
Private Investor | Capital Markets Expert
Martin Tremblay is a distinguished Private Investor and Capital Markets Expert with an extensive background in high-stakes financial advisory and strategic acquisitions. As a key figure at HCI, a premier capital advisory and mergers and acquisitions boutique firm with a presence in Montreal, Toronto, and New York, Martin brings a wealth of cross-border experience to the buyingoldnow.com community. His professional focus centers on identifying undervalued opportunities within established markets and navigating the intricate landscape of capital structures. With years of experience operating at the intersection of capital markets and private equity, Martin offers authoritative insights into the nuances of acquiring legacy assets and businesses. His expertise is grounded in a deep understanding of M&A processes, valuation methodologies, and the strategic deployment of capital. On buyingoldnow.com, he leverages his professional background to provide readers with actionable advice on securing and scaling established businesses for modern success. Martin is dedicated to demystifying the complexities of the investment world and is passionate about helping aspiring investors and entrepreneurs achieve long-term financial growth through informed decision-making.
LinkedIn Profile