
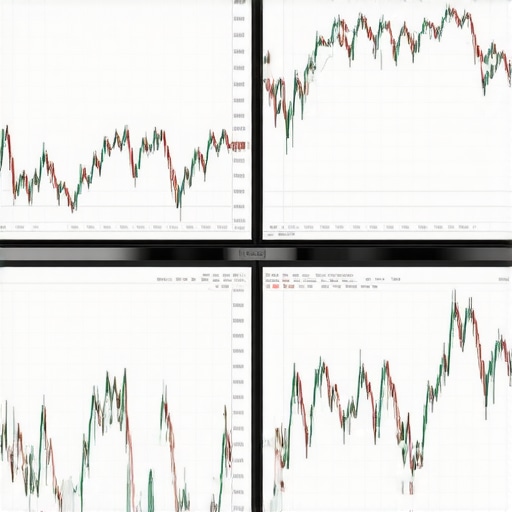
Harnessing Technical Indicators to Forecast Major Gold Price Breakouts
In the realm of precious metals trading, especially with gold, reliance on technical analysis has become indispensable for discerning imminent market shifts. Experts acknowledge that composite signals from indicators like RSI, moving averages, and volume can provide early warnings of significant gold price surges, enabling strategic positioning. A nuanced understanding of these signals, combined with macroeconomic insights, elevates an investor from reactive trader to proactive strategist.
Why Moving Averages and RSI Are Your Gold Trading Allies
Can Divergence Between Moving Averages and Momentum Oscillators Signal an Impending Bull Run in Gold?
Indeed, when the 50-day and 200-day moving averages converge or cross in a golden pattern, it often marks a pivotal moment for gold traders. Complementing this, a rising RSI reading above 70 can suggest overbought conditions, yet in the context of a breakout, it may confirm strong buying momentum. These technical nuances, when interpreted within the broader macroeconomic backdrop such as acceleration in central bank gold purchases, provide a strategic edge.
Quantum of Volume and Breakout Validation
Volume analysis functions as a confirmation tool; a surge in trading volume alongside price breakout signals enhances the reliability of predicted market moves. This approach aligns with the evolving understanding that markets tend to price in information progressively—thus, volume precedes price action, offering an anticipatory advantage. As central banks and institutional investors continue acquisitions, discerning these subtleties becomes crucial for accurate short-term forecasts.
Interpreting the Gold Price Chart Using Advanced Tools
Employing tools like Fibonacci retracements or Bollinger Bands in conjunction with traditional indicators can refine breakout predictions. For instance, when gold’s price pierces above a key Fibonacci level with high volume and RSI confirms strong momentum, it signals a potential new uptrend. Such confluence of signals, rooted in proven technical frameworks, is essential for expert traders aiming to leverage emerging gold market opportunities.
Incorporating Macro Variables for Contextual Depth
While technical indicators illuminate market mechanics, integrating macroeconomic variables—such as inflation rates, U.S. Treasury yields, and currency devaluations—provides comprehensive context. Recognizing how these factors influence gold’s technical patterns enhances predictive accuracy and informs risk management strategies. For example, rising Treasury yields may weaken gold prices, even amid bullish technical signals, underscoring the need for a multidimensional analytical approach.
For those interested in diversifying their gold portfolio through strategic entries, exploring how bullion can be integrated into retirement planning offers valuable insights. As the gold market continues to evolve, mastering the synthesis of technical indicators and macroeconomic analysis remains the hallmark of expert-level trading strategy.
Prompt for expert engagement: How do you integrate macroeconomic indicators with technical signals to refine your gold trading entries? Share your insights or explore more advanced strategies to elevate your gold investment approach.
Going Beyond Charts: The Impact of Macro Drivers on Gold Prices
While technical analysis offers valuable insights into short-term market movements, integrating macroeconomic fundamentals creates a more robust forecast framework. Variables such as inflation expectations, real interest rates, and geopolitical tensions often exert significant influence over gold’s trajectory. For instance, rising inflation prospects tend to boost gold demand as an inflation hedge, a relationship supported by research from the World Gold Council. Understanding how these macro drivers interact with technical signals empowers investors to refine entry and exit points, reducing reliance on lagging indicators alone.
Why Auction Data, Central Bank Flows, and Politics Matter
Exclusive data sources, including official central bank gold holdings and auction trends from international institutions, provide a behind-the-scenes glimpse into aggregate market sentiment. Central bank purchases, in particular, serve as a forward-looking indicator; consistent accumulation often signals institutional confidence in gold’s long-term store of value. Conversely, political uncertainties, such as escalating trade disputes or geopolitical conflicts, can trigger sudden surges in demand. As highlighted by financial experts from this comprehensive analysis, integrating political risk assessments with fundamental data can sharpen prediction accuracy.
Harnessing Price Action: Recognizing Market Life Cycles in Gold
Fundamental to advanced technical analysis is understanding how gold’s price structure reveals underlying market sentiment. Recognizing specific formations, such as head and shoulders, double bottoms, or ascending triangles, not only signals potential trend reversals or continuations but also provides insight into the market’s morphological evolution. Like a living organism, gold’s market exhibits phases—accumulation, expansion, distribution, and contraction—that reflect institutional behavior and macroeconomic influences. Expert traders track these patterns meticulously, interpreting their implications within a larger contextual framework.
The Nuanced Role of Divergence in Predictive Precision
One of the more sophisticated tools employed by technical analysts involves divergence analysis—particularly between price movements and momentum indicators like MACD or stochastic oscillators. For example, a bearish divergence—where price forms higher highs, but the indicator registers lower highs—often precedes a correction. Conversely, bullish divergence can herald a potential breakout from consolidation periods. Integrating these subtle signals with macro-level events enhances predictive accuracy, especially when paired with volume analysis and market sentiment surveys.
What Advanced Quantitative Models Elevate Gold Market Forecasting?
Beyond traditional indicators, quantitative models harness algorithms that incorporate machine learning, neural networks, and multivariate statistical analysis. These models analyze vast datasets—price history, macroeconomic variables, sentiment metrics—delivering probabilistic forecasts that adapt dynamically. For example, proprietary models developed by institutional traders incorporate real-time data feeds, credit spreads, and currency flows to generate actionable signals. According to research published in the “Journal of Financial Markets,” such models outperform classical technical analysis in predicting short-term market gaps and volatility spikes in commodities like gold.
Integrating Global Geopolitical Risks with Technical Readings
Governmental shifts, regional conflicts, and international sanctions inject volatility and create historical precedents that influence gold’s technical setup. War zones, trade blockade developments, or diplomatic stalemates often coincide with forming of key technical levels—support zones, breakout thresholds—that are magnified amid heightened uncertainty. For instance, geopolitical crises in recent years have repeatedly triggered sharp, rapid gold price appreciations that technical analysts could identify through sudden volume escalations and pattern breakouts. Consequently, staying vigilant to political developments, and understanding their technical footprints, is essential for comprehensive market intelligence.
How can investors quantify the impact of macro geopolitical shifts on gold’s technical patterns?
Quantification involves analyzing the correlation strength between geopolitical event timelines and technical anomalies such as volume surges or candlestick pattern formations. Sentiment indices derived from news sentiment analysis and real-time event tracking can be statistically correlated with price movements to generate predictive signals. Integrating these external models with core technical frameworks allows traders to calibrate their risk exposure more precisely, navigating unpredictable geopolitical waters with analytical confidence.
For those eager to deepen their tactical approach, consider exploring sophisticated data analytics platforms that process macro-political signals in tandem with real-time market data—a frontier where technology and expertise converge to redefine gold trading strategies. You can learn more about leveraging such tools through specialized analytical services or advanced research papers from the International Monetary Fund and World Gold Council.
Unlocking the Potential of Microeconomic Indicators for Enhanced Gold Forecasting
Among the myriad factors influencing gold prices, microeconomic indicators such as small-cap currency fluctuations and localized fiscal policies often serve as early warning signs of impending trend shifts. When combined with sophisticated technical analysis, these nuanced signals can significantly improve predictive accuracy. For instance, subtle shifts in a regional central bank’s reserve holdings might precede broader market movements, offering a strategic advantage to seasoned traders who interpret these micro-level cues within the larger macroeconomic landscape.
Polished Trading Algorithms and the Future of Gold Prediction
The advent of increasingly refined machine learning algorithms has revolutionized precious metals forecasting. Advanced models, trained on diversified datasets—including macroeconomic metrics, sentiment analysis, and real-time geopolitical events—are capable of recognizing complex patterns invisible to traditional analysis. These systems continually adapt, providing traders with probabilistic insights into short-term price trajectories. As documented by the MIT Sloan School of Management, the integration of AI-driven models has demonstrated a marked improvement in predicting volatility spikes in the gold market, emphasizing the importance of embracing technological evolution for strategic advantage.
Expert-Level Question: How does the interplay between bond yield fluctuations and breakout signals refine gold trading strategies?
Bond yields, particularly in the U.S. Treasury market, exert a profound influence on gold’s technical patterns. When rising yields coincide with breakout formations—such as a decisive close above resistance levels accompanied by increased volume—it suggests a shift in investor risk appetite and inflation expectations. Conversely, declining yields during a consolidation phase might signal the accumulation of safe-haven assets like gold, setting the stage for a potential rally. Integrating these macro fixed-income signals with classic breakout confirmation enhances the precision of trading entries and exits, an approach endorsed by experts in financial engineering from the University of Chicago.
For those seeking to deepen their mastery of these multifaceted indicators, exploring platforms that synthesize bond yield data with technical analytics can unlock new dimensions of market insight. Engage with such tools to harness the full spectrum of signals shaping gold’s future trajectory.
Beyond Price Charts: Spotlight on Supply Chain Dynamics and Miner Sentiment
While market technicals and macro indicators paint a compelling picture, the physical supply chain’s health and investor sentiment among gold miners often serve as overlooked yet pivotal signals. Disruptions in supply—due to logistical bottlenecks, mining strikes, or regulatory hurdles—can precipitate sharp upward movements, especially when technicals are supportive. Additionally, sentiment surveys among mining executives and institutional investors can provide prescient insights into future supply constraints or bullish outlooks, adding a layered depth to the analytical toolkit for top-tier traders.
Harnessing Sentiment Indexes and Market Psychology for Precise Timing
Market psychology exerts a subtle yet powerful influence on gold price movements. Advanced traders leverage sentiment indexes, including the Consumer Sentiment, the Commitment of Traders reports, and social media analytics, to gauge prevailing investor mood. When technical indicators signal a potential breakout and sentiment surveys reflect growing optimism about inflation hedging, the probability of a sustained rally increases substantially. This confluence of data reduces the risk of false breakouts and enhances the timing precision of entries.
Strategic Integration of Political Analytics and Financial Models
In today’s interconnected world, political analytics—covering diplomatic negotiations, trade policy shifts, and election outcomes—must be woven into technical frameworks. Quantitative models that incorporate political risk scores, geopolitical event calendars, and sentiment shifts enable investors to anticipate market reactions before they unfold on charts. For example, a pending trade agreement or tariffs dispute could act as a catalyst, aligning with technical breakouts confirmed by volume and momentum indicators. Recognizing this interplay empowers traders to navigate complex geopolitical terrains with increased confidence.
How can seasoned traders leverage political risk assessments in conjunction with advanced technical signals to optimize gold entry points?
By integrating real-time political risk metrics with algorithmic trading platforms, investors can develop dynamic risk profiles that adapt instantly to unfolding geopolitical events. Employing scenario analysis, sensitivity testing, and Bayesian inference methods enhances decision-making, enabling traders to differentiate between false signals and genuine market shifts. Monitoring political developments alongside technical confirmations crafts a more resilient strategy—one that is both agile and well-informed in the face of global uncertainty. To master these techniques, consider engaging with specialized analytics services that synthesize political and market data, equipping your investment approach with an unparalleled edge in gold trading.
Refined Indicators for More Accurate Gold Predictions
Leverage combined signals from multiple technical tools to identify more reliable breakout points, minimizing false positives. For example, pairing Fibonacci retracements with volume spikes offers a nuanced view of emerging trends, empowering traders to act with confidence.
Stay Ahead with Macro and Microeconomic Clues
Monitor not just macroeconomic shifts like inflation expectations and geopolitical tensions, but also microeconomic signals, such as regional demand fluctuations and miner sentiment. These layers of analysis refine your timing, turning strategic anticipation into tangible gains.
Harness Institutional Data for Competitive Edges
Incorporate data from central bank purchases, auction trends, and official reserve reports. Recognizing accumulation patterns among major players often precedes significant price moves, giving astute investors a critical advantage in positioning ahead of the crowd.
Explore Cutting-Edge Quantitative Models
Adopt machine learning algorithms and neural network-based analyses that process vast datasets. These sophisticated models predict short-term volatility and price gaps more accurately than traditional indicators, transforming raw data into actionable intelligence.
Integrate Political and Sentiment Analytics
Advance beyond pure chart analysis by including political risk assessments and social sentiment analysis. Recognizing the subtle influence of geopolitical events and market psychology can help anticipate sudden shocks or rallies, refining your strategic entries and exits.