

In the complex landscape of precious metals, understanding the significance of major support levels in gold prices is crucial for sophisticated investors. These levels often serve as the battleground between bullish resilience and bearish momentum, offering vital clues about market sentiment and future trajectory. As gold continues to react to macroeconomic shifts, geopolitics, and central bank policies, recognizing when the price hits a significant support can inform strategic decisions and risk management approaches.
Unveiling the Market Mechanics Behind Gold’s Support Levels
Support levels in gold are established through a confluence of technical indicators, market psychology, and fundamental factors. They reflect a price corridor where buying interest historically outweighs selling pressure, often due to long-term investor accumulation, central bank reserve adjustments, or geopolitical tensions. Advanced technical analysis tools, such as Fibonacci retracements and moving averages, enable traders to identify these pivotal points with greater precision.
How Do Central Bank Gold Purchases Reinforce Support Zones?
Central banks play an instrumental role in underpinning gold’s price floor through strategic reserves acquisitions or sales. When global monetary authorities increase their gold holdings—often as a hedge against dollar depreciation or geopolitical instability—it signals underlying confidence and creates a psychological foundation for support levels. Analyzing data from the World Gold Council reveals that recent central bank purchases have been pivotal in curbing downside risks during volatile periods.
Implications of Support Levels for Gold Supply and Demand Dynamics
Support levels are intricately linked to broader supply-demand trends. When prices dip to these zones, physical demand—especially from emerging markets and technology sectors—tends to surge, reinforcing the support. Conversely, a break below critical support could precipitate a swift decline driven by liquidation of gold mining stocks and ETFs, as investors react to deteriorating fundamentals. Recognizing these signals early enables market participants to position themselves advantageously amidst shifting gold demand trends.
Can Gold Mining Stocks Survive a Support Break, or Will They Crumble Further?
This complex inquiry resonates among industry analysts and institutional investors. While some posit that gold mining stocks are leveraged plays that tend to amplify gold’s price movements—implying risk of significant decline if support fails—others argue that sector-specific factors, such as operational efficiencies and jurisdictional stability, may cushion the blow. For insights on navigating this terrain, refer to our comprehensive review of gold mining stocks versus gold-backed mutual funds.
Understanding the nuanced interplay of technical support levels, central bank policies, and supply-demand fundamentals equips investors with an advanced framework to anticipate market shifts. To deepen your expertise, explore our detailed analysis on comprehensive gold market analysis and sharpen your strategic edge.
Reevaluating Support Levels: Are They Truly Market Anchors or Just Psychological Barriers?
Support levels in gold often serve as critical decision points for traders and investors alike, but their reliability hinges on more than just historical price action. Recent research indicates that the psychological resilience of these levels can be amplified or diminished by macroeconomic news, geopolitical developments, and shifts in investor sentiment. For instance, the impact of rising inflation expectations can temporarily strengthen support zones, leading to increased physical demand and renewed central bank interest. Conversely, unexpected policy announcements or economic data releases can cause supports to weaken unexpectedly, underscoring the necessity of integrating fundamental analysis with technical signals for optimal decision-making.
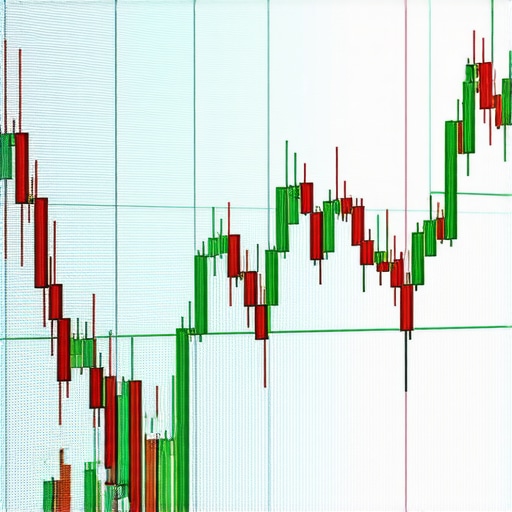
Beyond the Charts: How Geopolitical Tensions Continuously Shape Support Dynamics
Geopolitical tensions remain a pivotal driver influencing gold’s support zones. Crisis events, whether diplomatic conflicts, military confrontations, or trade disputes, tend to catalyze safe-haven flows that reinforce support levels. Observing patterns during recent crises suggests that persistent geopolitical risks can embed support levels more firmly into market psyche, making them less susceptible to short-term volatility. Experts emphasize that tracking geopolitical developments—such as the BRICS nations’ strategic gold acquisitions—can provide predictive insights into long-term support resilience. For a comprehensive understanding of geopolitical impacts, consult our analysis on the influence of global geopolitics on gold demand.
How Can Investors Differentiate Between False Breakouts and Genuine Support Breaks in Gold?
One of the most pressing challenges for traders is distinguishing between deceptive breakouts and authentic breakdowns in support levels. False signals, often triggered by short-term speculative moves or algorithmic trading, can lead to costly misjudgments. Advanced techniques such as volume analysis during support breaches, combined with momentum indicators like the RSI and MACD divergences, can enhance accuracy. Moreover, understanding the context—such as macroeconomic headlines or central bank policies—provides invaluable cues to filter out noise. For in-depth strategies on recognizing these crucial moments, explore our guide on using technical tools for precise gold entry points.
Seeking a nuanced perspective on the evolving gold market? Our detailed analyses and expert insights can help you craft resilient strategies that withstand market complexities—visit comprehensive gold market analysis for more.
Deciphering Price Rebounds: The Significance of Historical Support Anchors
In the intricate dance of market dynamics, historical support levels in gold act as crucial reference points where buyer interest has historically outstripped selling pressure. These zones often emerge from a confluence of macroeconomic fundamentals and market psychology, serving as a testament to collective investor behavior. When gold approaches these levels, a nuanced analysis considering trendline integrity, volume patterns, and macroeconomic signals can unearth opportunities that aren’t immediately apparent. For instance, during periods of rising institutional allocations, support levels tend to solidify, reflecting a fundamental shift in gold’s role within diversified portfolios.
High-Frequency Trading’s Role in Support Level Volatility
Emerging research underscores that high-frequency trading (HFT) algorithms can introduce significant noise into gold’s price action, particularly around established support zones. These rapid trades, executed in microseconds, often exploit fleeting technical inefficiencies, leading to false breakouts or premature rebounds. Understanding the interaction between HFT and support levels requires a sophisticated approach—integrating order book analysis, real-time volume flow insights, and anomaly detection algorithms. Recognizing the tell-tale signs of HFT-induced volatility helps traders avoid costly missteps and better interpret genuine market movements.
How Do Macroeconomic Indicators Fortify or Weaken Support Structures?
Global economic indicators such as inflation rates, GDP growth, and unemployment figures exude powerful influence on gold’s support landscape. For instance, soaring inflation often bolsters physical demand, reinforcing support levels as investors seek inflation hedges. Conversely, unexpectedly robust economic data may diminish gold’s safe-haven appeal, subtly weakening support. Advanced analysis involves constructing macroeconomic sentiment indices and correlating them with technical support zones, enabling investors to anticipate potential shifts before price action confirms them. A deep understanding of these indicators is vital for proactive positioning, especially in volatile regimes.
Can Reinforced Support Levels Predict the Next Bull Run in Gold Prices?
This pivotal question beckons a rigorous examination. Historically, sustained rebounds from robust support zones have marked the onset of primary bullish phases, especially when accompanied by converging fundamental catalysts such as central bank gold purchases, technological demand spikes, and geopolitical stability. Confirming these predictive linkages necessitates a multi-layered approach—combining technical analysis, macroeconomic momentum, and geopolitical risk assessment. A comprehensive understanding of these interactions can help investors anticipate long-term upward trajectories, turning support levels into strategic entry points for significant gains.
If you aspire to deepen your mastery over gold’s complex support dynamics, engaging with predictive analytics models and tailored risk management frameworks becomes essential. For in-depth guidance, explore our curated resources tailored for advanced investors seeking to leverage support and resistance zones effectively.
Integrating Derivative Markets: How Futures and Options Shape Support Expectations
In the realm of sophisticated trading, derivative instruments such as gold futures and options significantly influence support levels. Large open interest positions, whether in the form of hedge fund futures or commercial options, act as indicators of market sentiment and potential support fortification. A surge in call options at key support levels, for instance, may denote bullish conviction, whereas increasing puts could signal looming breakdowns. Comprehending the positioning and implied volatility embedded within derivatives markets provides an edge—especially when gauging the sustainability of support zones amidst volatile macro conditions.
What Advanced Signal Confirmations Enhance Support Level Reliability?
To improve predictive accuracy, traders often integrate multiple technical signals—such as volume-weighted average prices (VWAP), order flow analytics, and divergence patterns across oscillator indicators. Combining these with macroeconomic data releases and geopolitical risk assessments creates a holistic view, allowing for more confident decision-making. Moreover, employing machine learning algorithms to identify subtle, non-linear patterns in multi-dimensional data sets can reveal support zones with higher probability of holding in turbulent markets. As technology evolves, mastering these advanced tools becomes indispensable for elite investors.
By continuously refining your analytical arsenal and staying attuned to the interplay between technical signals, macro factors, and derivative market positioning, you elevate your strategic framework for navigating gold’s support landscape. For expert insights and tailored analysis, consider engaging with specialized market research services dedicated to high-net-worth investors and institutional strategists.
Unlocking the Hidden Power of Price Clusters to Predict Gold’s Next Move
In the realm of elite trading, recognizing the significance of price clusters—areas where multiple technical signals converge—can dramatically enhance support level reliability. Such zones often symbolize collective market consensus derived from a blend of order book liquidity, institutional positioning, and macroeconomic sentiment. Advanced pattern recognition, including volume profile analysis and market microstructure insights, enables traders to identify these dense zones, which often precede significant trend reversals or accelerations. Integrating these nuanced indicators with macro factors provides a robust framework for anticipating gold’s directional shifts.
What Role Do Order Flow Analytics Play in Confirming Market Support?
Order flow analytics delve into the granular level of trade execution data, illustrating real-time supply and demand imbalances. By scrutinizing bid-ask spreads, delta (buy versus sell volume), and footprint charts, seasoned traders uncover the subtle tug-of-war at pivotal support zones. Such techniques often reveal whether institutional players are absorbing sell-offs or stepping in at support levels, thereby validating their strength or signaling potential breakdowns. Leveraging order flow data bridges the gap between technical signals and underlying market intentions, vastly improving support confirmation.
Leveraging Macrostructural Analysis to Anticipate Support Durability
Beyond immediate price action, macrostructural analysis examines the overarching economic terrain influencing gold’s supply-demand equilibrium. This includes evaluating sovereign reserve policies, industrial demand forecasts, and geopolitical risk indices. An emerging area of focus involves applying network theory to assess the interconnectedness of global financial systems, revealing how systemic shocks might weaken or reinforce support structures. Expert traders develop composite models that synthesize macroeconomic indicators with micro-level signals, offering a probabilistic view of support sustainability amid evolving global conditions.
Given these layered complexities, it’s prudent for investors to harness multidisciplinary insights—combining technical finesse with macroeconomic acuity—to master gold’s support terrain. Engage with cutting-edge analytical tools and deepen your understanding through authoritative resources such as the Financial Times Commodities Section for real-time intelligence.
Dynamic Support Areas and the Impact of Algorithmic Trading Patterns
Rapid technological advancements have transformed support zone behavior, especially with the proliferation of algorithmic trading. Some algorithms are programmed to execute trades conditioned on support breaches, exacerbating volatility or creating false signals. Sophisticated algorithms also employ machine learning to recognize support strength based on historical data patterns, learning from past false breakouts to avoid premature exits. Monitoring these algorithmic dynamics—via tools like transaction cost analysis and latency tracking—empowers traders to differentiate between genuine support erosion and manipulated price noise, fostering more strategic decision-making.
How Can Traders Combine Algorithmic Insights with Traditional Analysis?
Blending the deterministic precision of algorithmic patterns with qualitative traditional analysis requires a nuanced approach. Techniques include setting adaptive stop-loss orders informed by real-time HFT activity indicators, and employing multi-timeframe analysis to confirm support zones resilient to algorithmic whipsaws. Developing proprietary models that incorporate order book depth, trade velocity, and macroeconomic headlines ensures a comprehensive perspective, reducing reliance on false signals and facilitating confidence in support-related trades. For dedicated traders, investing in bespoke analytics platforms can be transformative in this high-frequency environment.
Stay ahead by continuously refining your understanding of the multifaceted forces shaping gold’s support landscape. Explore our curated resources for insider strategies on advanced gold trading techniques.
In the realm of gold investing, it’s essential to perceive support levels not merely as static price points but as dynamic indicators reflecting underlying market forces. Recognizing the subtle shifts and the macroeconomic undercurrents that influence these levels can position investors ahead of major market movements.
Expert Strategies for Interpreting Gold’s Support Zones
Leverage Macro Trends to Anticipate Support Durability
By integrating macroeconomic indicators—such as inflation rates, central bank policies, and geopolitical risks—into your technical analysis, you can better gauge whether support levels are poised to hold or falter. This holistic approach enhances predictive accuracy, enabling more confident decisions.
Assess Market Microstructure to Validate Support Strength
Order flow analysis, including bid-ask spreads and trade volume patterns at support zones, offers granular insights into institutional activity. This depth of analysis aids in distinguishing genuine support from deceptive signals, a crucial skill in high-stakes trading.
Utilize Derivative Market Positions as Sentiment Indicators
Tracking futures open interest and options positioning at key support levels reveals market sentiment and potential turning points. Elevated open interest coupled with supportive macroeconomic data often signals resilient support zones.
Stay Attuned to Geopolitical Developments
Geopolitical tensions frequently reinforce gold’s safe-haven appeal, solidifying support levels. Monitoring events like trade disputes or military conflicts can provide foresight into support resilience or vulnerabilities, guiding strategic entries and exits.
Recognize When False Breakouts Occur and How to Respond
Employ advanced indicators—such as volume confirmation and divergence analysis—to avoid falling prey to false support breaches. Timely identification of these signals preserves capital and maintains trading discipline.
Refined Resources for the Astute Gold Investor
Enhance your expertise by consulting authoritative sources like the World Gold Council’s reports on central bank holdings, or diving into data-driven analyses on gold price movements. Additionally, engaging with technical analysis tools such as moving averages and volume profiles can refine your tactical decisions.
Elevate Your Approach: The Final Word on Support Strategy
Mastering gold’s support levels requires a confluence of technical acuity, macroeconomic understanding, and behavioral insight. When these elements harmonize, you’re empowered to forecast and navigate gold’s price landscape with a high degree of sophistication. Continual education and diligent analysis forge the pathway to strategic mastery—mature investors know this is an ongoing journey. To deepen your understanding, explore our comprehensive gold market analysis and transform your approach today.